smartctl-exporter
在需要监控的机器上安装smartctl-exporter的Docker容器:
services:
  smartctl-exporter:
    image: prometheuscommunity/smartctl-exporter:latest
    user: "0:0"
    privileged: true
    restart: unless-stopped
    ports:
      - "9633:9633"
    command:
      - "--smartctl.interval=60s"
      - "--smartctl.rescan=10m"
      - "--web.listen-address=:9633"
Prometheus配置抓取,新增如下的抓取job配置:
scrape_configs:
  - job_name: truenas-smart
    scrape_interval: 60s
    static_configs:
      - targets: ["TrueNAS的IP:9633"]
grafana面板ID:22381。
https://grafana.com/grafana/dashboards/22381-smartctl-exporter/
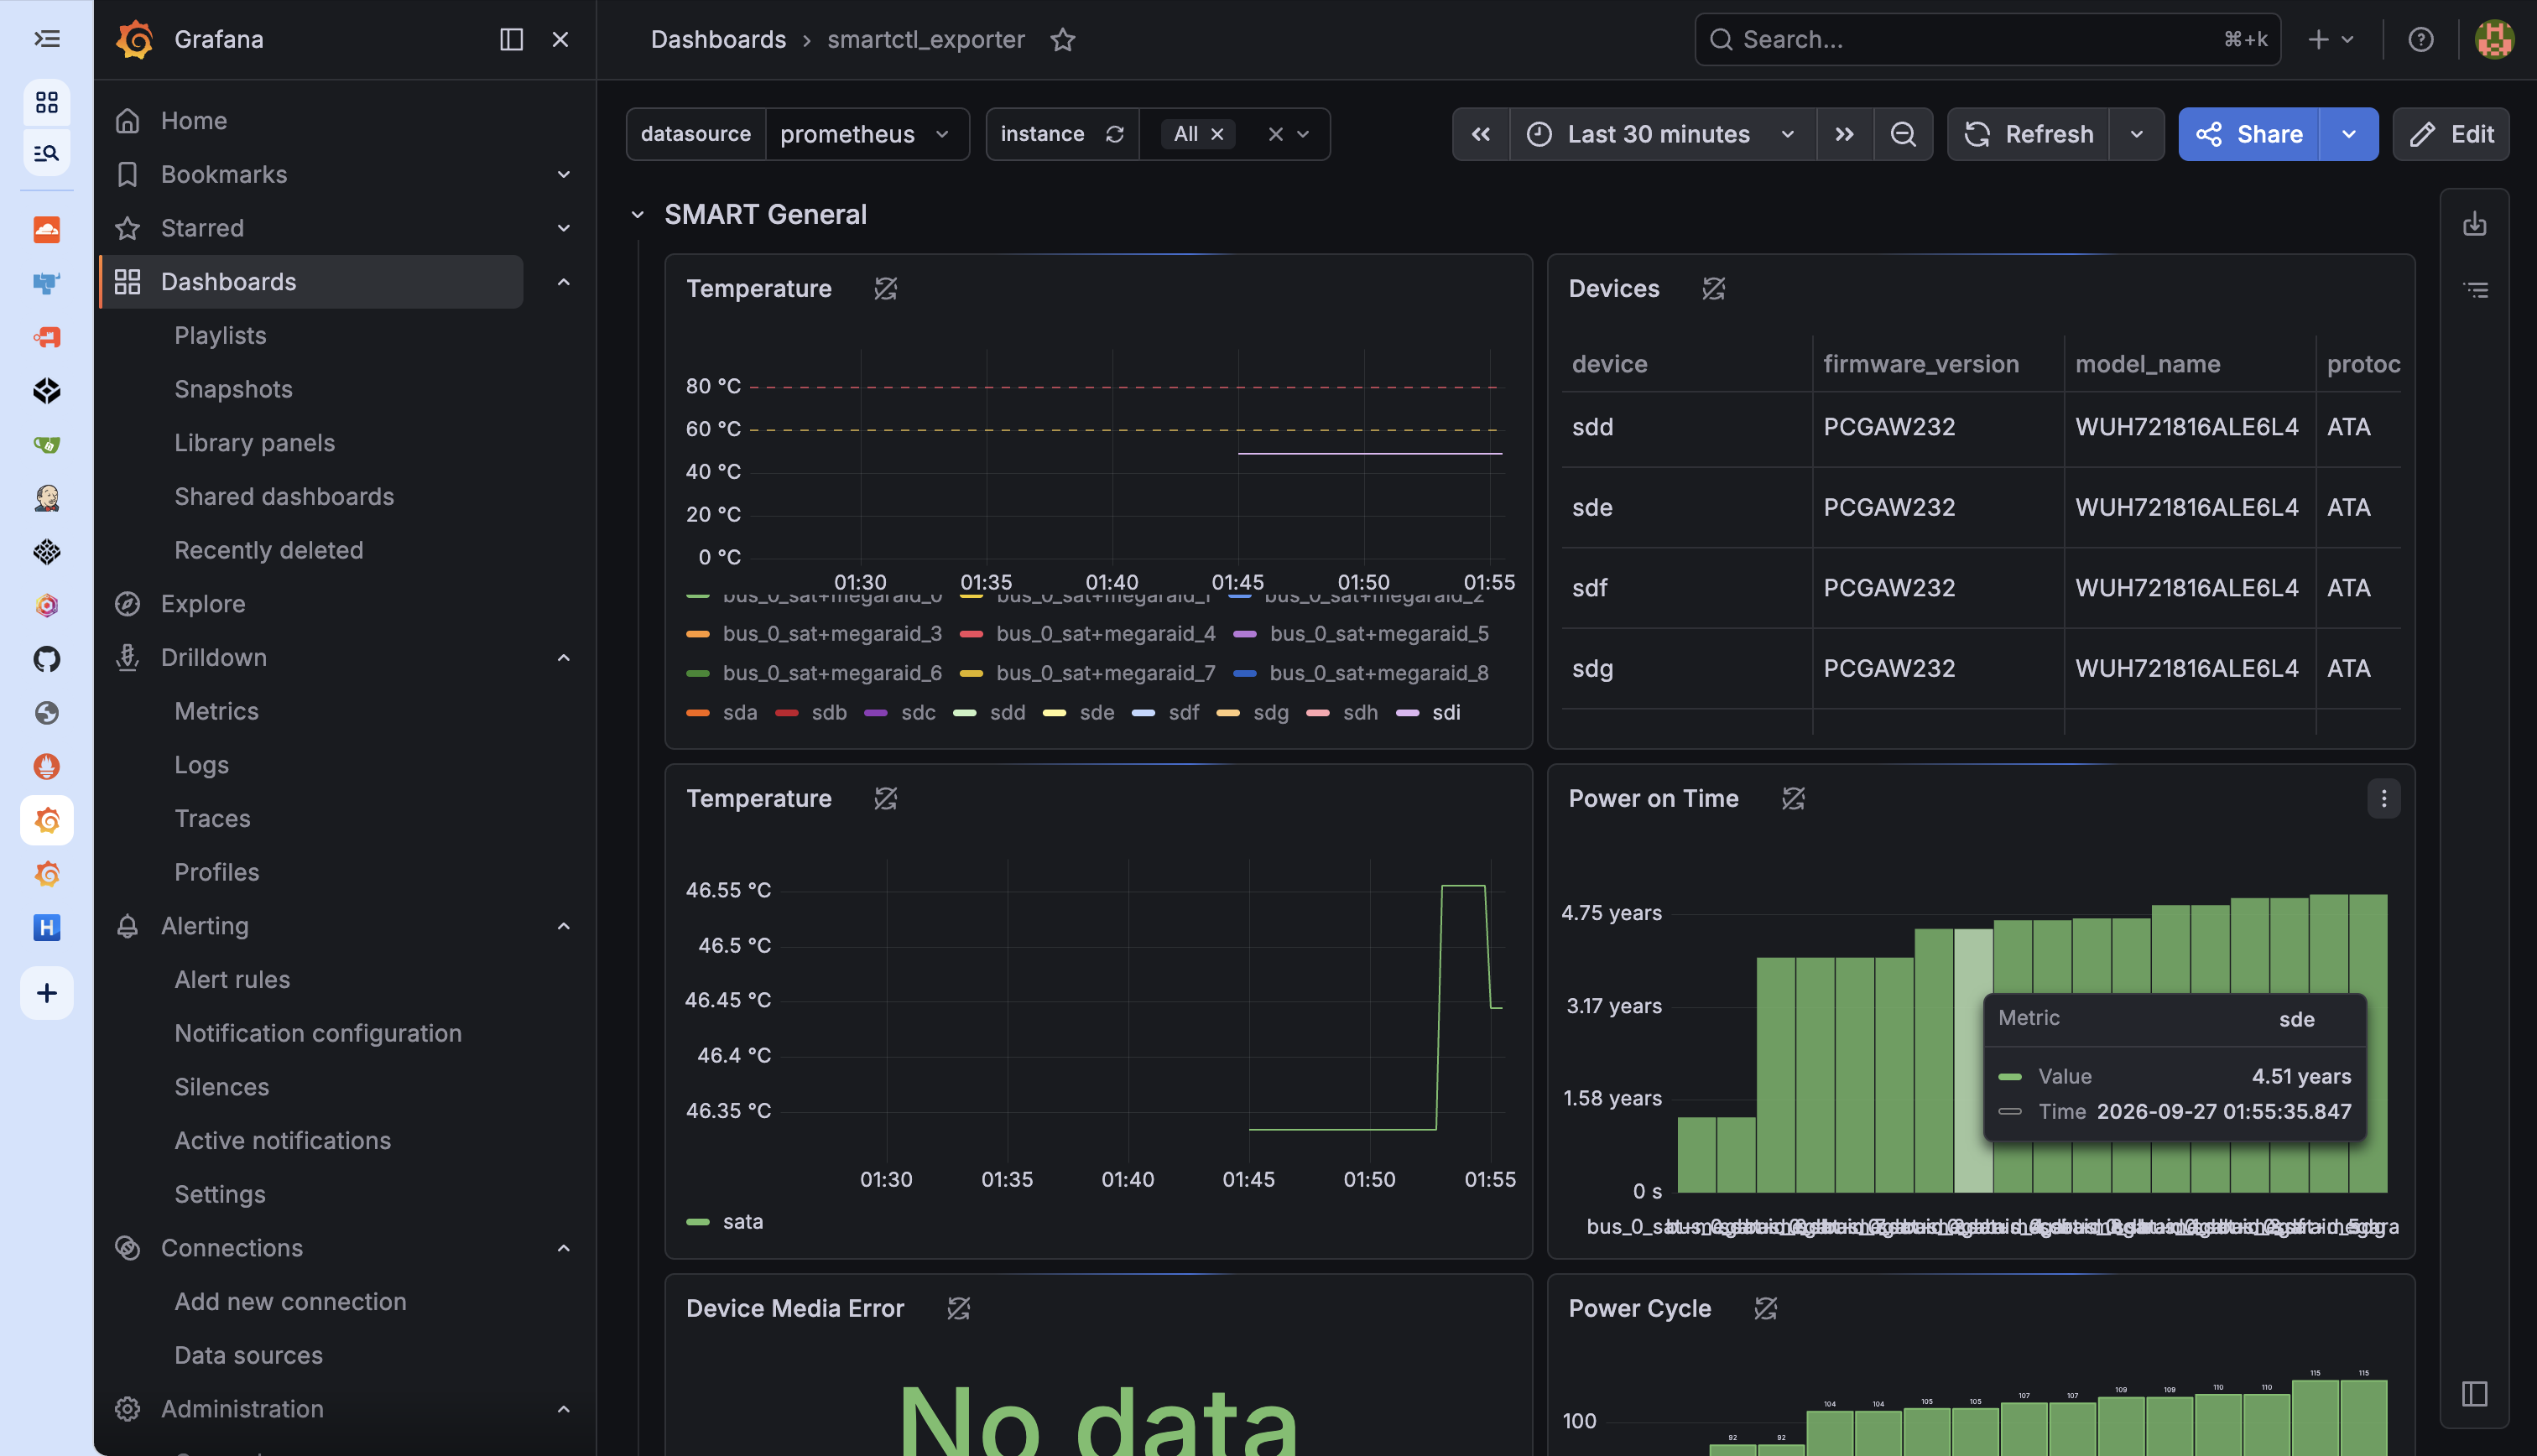
打开之后可以看到如下的Grafana页面:
评论